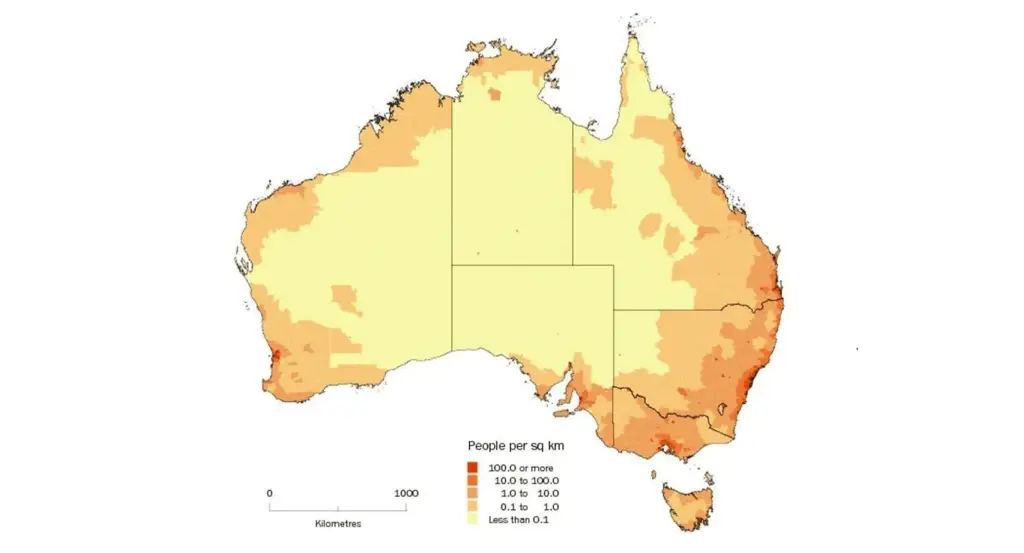
The Australian real estate landscape is ever-evolving, painted with the broad strokes of population growth and the nuanced details of fluctuating property prices. A closer examination reveals a fascinating correlation between burgeoning populations and escalating property values across various Australian locales. This blog post delves into this dynamic interplay, spotlighting specific cities and urban areas that stand as testaments to this phenomenon.
Population Growth: A Catalyst for Property Market Dynamics
At the heart of the property market’s vitality is the demand driven by population growth. As people flock to an area, the demand for housing intensifies, often resulting in a noticeable uptick in property prices. This effect is particularly pronounced in regions witnessing robust growth rates, where the surge in residents amplifies the need for both residential and commercial properties.
Let’s explore two illustrative tables that shed light on the population growth in Australian cities and significant urban areas, providing a window into the consequent shifts in the property market.
A Closer Look at Capital City Population Trends
Our first table lays out the growth trajectories of Greater Capital City Statistical Areas, offering insights into how these trends potentially impact property demand and pricing:
| Rank | Greater Capital City Statistical Area | State/Territory | Estimated Resident Population June 2023 | Estimated Resident Population June 2011 | Growth from 2011 to 2022 | Included SUAs |
|---|---|---|---|---|---|---|
| 1 | Australian Capital Territory[a] | Australian Capital Territory | 466,566 | 367,985 | 26.79% | Canberra–Queanbeyan (ACT part only) |
| 2 | Greater Brisbane | Queensland | 2,706,966 | 2,147,436 | 26.06% | Brisbane |
| 3 | Greater Perth | Western Australia | 2,309,338 | 1,833,567 | 25.95% | Perth |
| 4 | Greater Melbourne | Victoria | 5,207,145 | 4,169,366 | 24.89% | Melbourne, Bacchus Marsh, Gisborne |
| 5 | Greater Sydney | New South Wales | 5,450,496 | 4,608,949 | 18.26% | Sydney, Central Coast |
| 6 | Greater Hobart | Tasmania | 253,654 | 216,273 | 17.28% | Hobart |
| 7 | Greater Darwin | Northern Territory | 150,736 | 129,106 | 16.75% | Darwin |
| 8 | Greater Adelaide | South Australia | 1,446,380 | 1,264,091 | 14.42% | Adelaide |
Cities like the Australian Capital Territory and Greater Brisbane, showcasing significant population upticks, are likely experiencing increased housing demand, thereby pushing property prices upward.
Unveiling Population Dynamics in Significant Urban Areas
Our second table zooms into Significant Urban Areas, unveiling their population growth:
| Rank | Significant Urban Area* | State/Territory | Estimated Resident Population June 2023 | Estimated Resident Population June 2011 | Growth from 2011 to 2023 |
|---|---|---|---|---|---|
| 1 | Warragul–Drouin | Victoria | 45,597 | 30,287 | 50.55% |
| 2 | Bacchus Marsh | Victoria | 26,055 | 17,488 | 48.99% |
| 3 | Airlie Beach-Cannonvale | Queensland | 15,723 | 10,982 | 43.17% |
| 4 | Busselton | Western Australia | 43,853 | 31,475 | 39.33% |
| 5 | Sunshine Coast | Queensland | 407,859 | 303,824 | 34.24% |
| 6 | Geelong | Victoria | 302,046 | 227,957 | 32.50% |
| 7 | Morisset–Cooranbong | New South Wales | 29,421 | 22,644 | 29.93% |
| 8 | Yeppoon | Queensland | 21,688 | 16,815 | 28.98% |
| 9 | Medowie | New South Wales | 16,058 | 12,686 | 26.58% |
| 10 | Gold Coast–Tweed Heads | Queensland/New South Wales | 735,213 | 581,036 | 26.53% |
| 11 | Brisbane | Queensland | 2,622,585 | 2,076,608 | 26.29% |
| 12 | Perth | Western Australia | 2,289,366 | 1,817,023 | 26.00% |
| 13 | Melbourne | Victoria | 5,103,528 | 4,087,822 | 24.85% |
| 14 | Ballarat | Victoria | 116,390 | 93,459 | 24.54% |
| 15 | Canberra–Queanbeyan | Australian Capital Territory/New South Wales | 503,402 | 405,032 | 24.29% |
Intriguingly, locales like Warragul–Drouin and Bacchus Marsh exhibit staggering growth rates above 48%, hinting at burgeoning demand for housing. Such exponential growth is a beacon for both investors and homeowners, marking these areas as burgeoning hotspots within Australia’s property market.
Strategic Implications for Stakeholders
This intricate dance between population growth and property prices has profound implications. For investors, areas marked by surging populations present ripe opportunities for capital gains and enhanced rental yields. Conversely, potential homeowners may encounter highly competitive markets with soaring prices, underscoring the importance of astute and timely purchasing decisions.
Moreover, an in-depth understanding of these dynamics can unveil emerging markets brimming with potential for future growth, offering a strategic edge in the quest for property investment success.
In Conclusion
The symbiotic relationship between population growth and property prices forms the backbone of Australia’s real estate market. By dissecting trends and growth rates across diverse regions, stakeholders can navigate the market with informed precision, whether in pursuit of investment opportunities or in the search for a new home. As Australia continues on its path of growth and development, staying abreast of these population and property market dynamics will be indispensable for those looking to thrive in the vibrant landscape of Australian real estate.
